Who doesn't remember the dancer JSM who appeared on all possible touchpoints for three consecutive years, dancing to the notes of "All Night" by Parov Stelar and "Another Day of Sun", the soundtrack from La la land?
In October 2016, TIM asked BrainSigns to measure, through a neuromarketing approach, the instinctive response of a TLC target sample to the new "Dancer" commercial accompanied by All night music. The spot was to be broadcast on New Year's Eve, representing a radical change from the communication format then on air.
Neuromarketing methods could predict- three months before the launch- that this new communication format would be a great success. Through measurement of heart rate, skin conductance, and brain indicators and eye movement tracking, during the pre-testing, an unprecedented successful potential of this audio communication was revealed through a repeated exposure study.
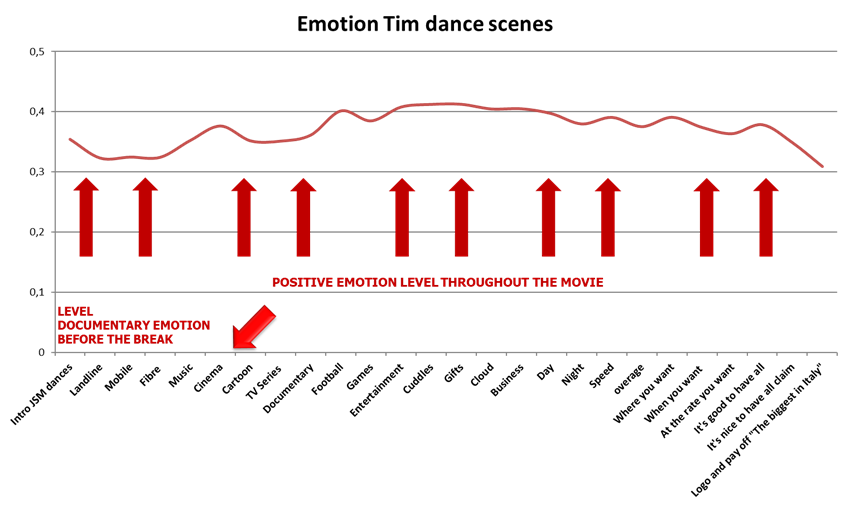
In particular, the values of the emotion indicator generated by the commercial with the music in the test remained constantly positive and high throughout its duration (Fig. 1). The lively, friendly, cheerful and fun music - through its timbre and notes- acted directly on the emotion.

Figure 1: Emotion indicator for the scenes (time segments) of the TIM October 2016 commercial - 60 seconds
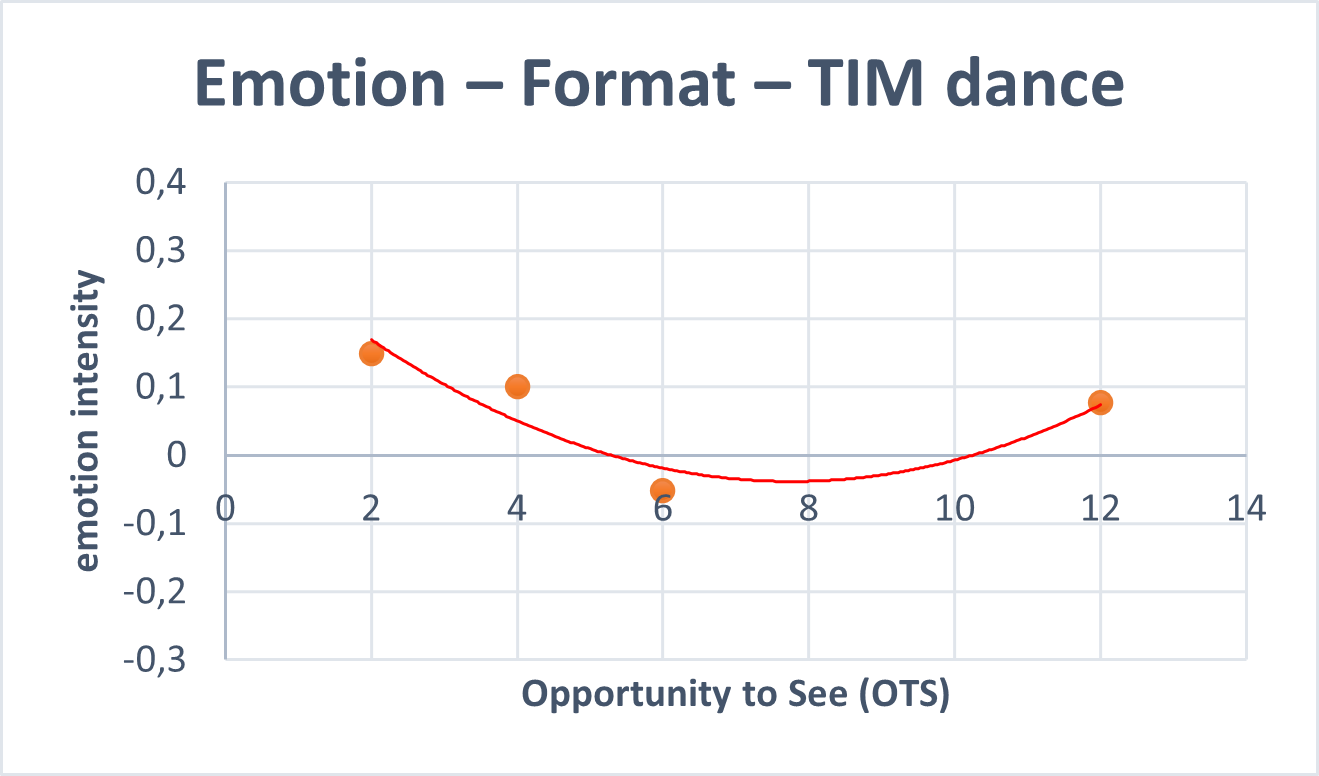
Particularly promising were the results of a succession of repeated tests on the same experimental subjects as the number of test commercial's views increased. One of the many potentials of neuromarketing is to measure the optimal frequency of repeated exposure, in other words, to determine when an advertisement becomes "boring / less effective". Usually, after a few exposures, emotional involvement decreases without recovering (wear out).
For this advertisement, on the other hand, the emotion immediately was high. It gave way to a greater cognitive interest with the informational content, and finally, the more it was seen (even after 10-12 exposures) the more engagement increased again. (Fig. 2).
The study carried out two months before the launch, had already predicted the format's success, which was then confirmed in the following months.

Figure 2: Emotion indicator curve as Opportunity To See (OTS) increases


